Latest Data: 2020
This page examines the drinking habits of UK professional archaeologists in 2019-20.
Highlights
Share this Research
For the first time, in the 2019-20 Profiling the Profession survey, data were collected on the drinking habits of archaeologists. This was collected from the individuals’ survey – see the methods section for more details on the Profiling the Profession data collection methods. The data collection was designed to align with the NHS Statistics on Alcohol so there are national data to compare archaeologists against. Respondents were asked if they drink alcohol and if they answered yes, how many of units of alcohol they drank in the previous week (the question asked by the NHS), with some prompts on what drinks likely constitute an unit of alcohol.
NHS England data is used for comparison. This is because the ONS has stopped collected data on drinking habits, the NHS data are considered to be national statistics and both Scotland‘s & Wales‘ data show almost the same results but Scotland’s data are from 2018. Given the results (by geographical location) are almost identical, the data from NHS England were used as a proxy for the whole UK because it was the most recent information available. As noted by the ONS:
‘Social surveys consistently produce estimates of alcohol consumption that are lower than the levels indicated by alcohol sales data. This is likely to be because people either knowingly or unknowingly underestimate their alcohol consumption. Despite this (the) data give an insight into people’s perceptions of their drinking habits.’
Our results are the same, they report archaeologists’ perceptions of their drinking habits. Or, in the case of those that do not drink, their actual habits.
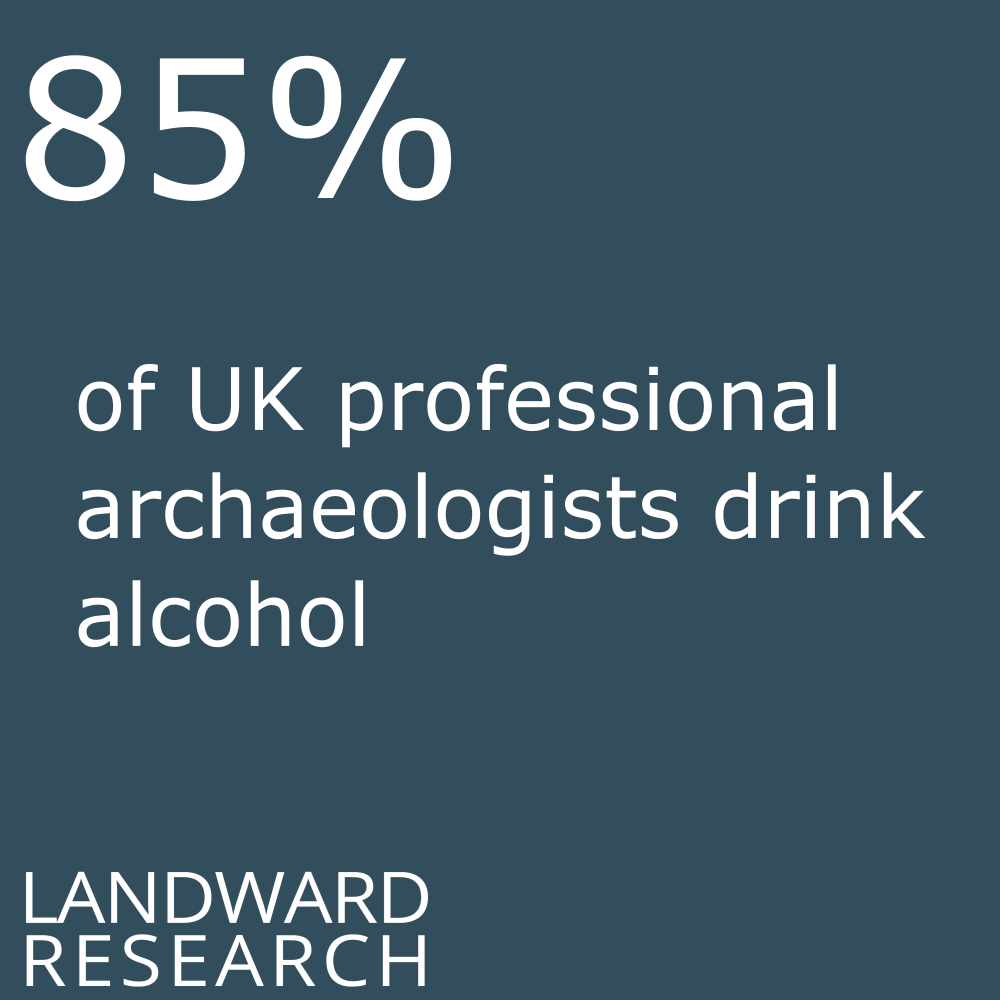
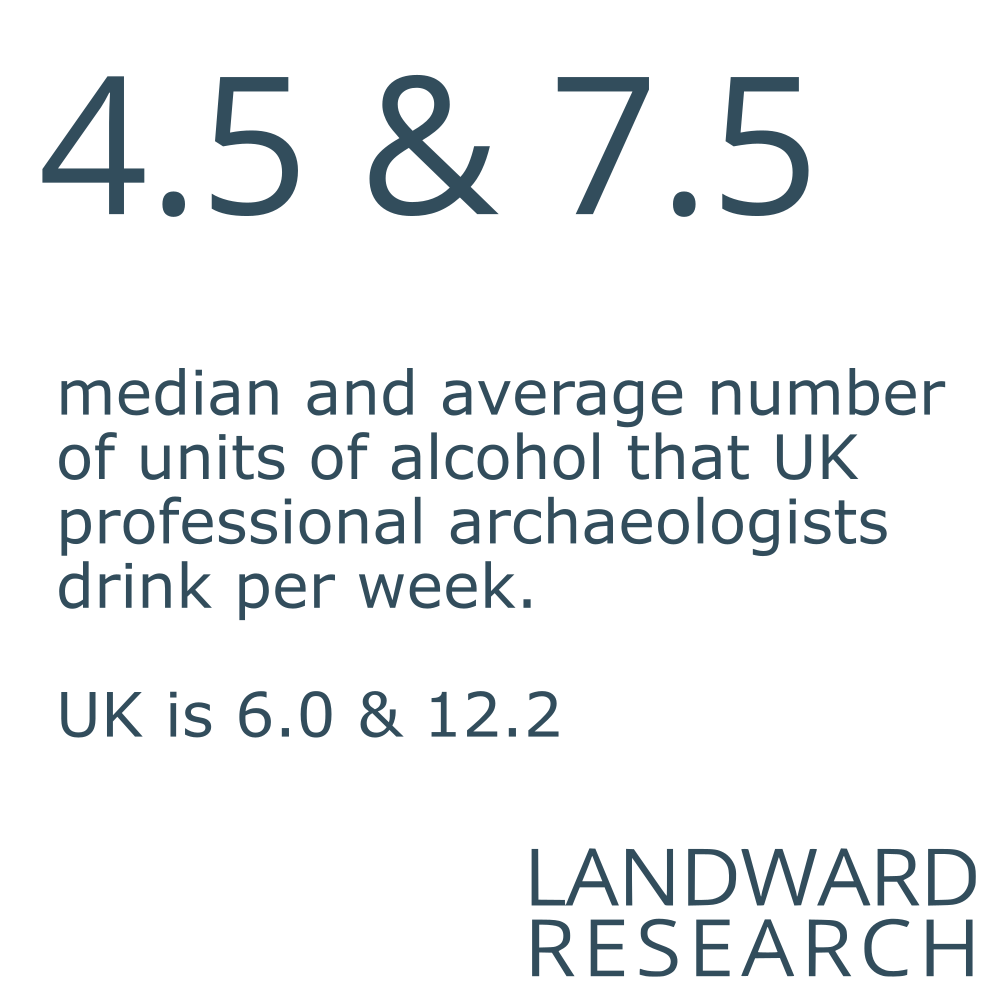
The results show that archaeologists are slightly more likely to drink than the general population but less likely to drink as heavily. Both mean and median number of units are below the national figures. It has been hypothesised that the drinking culture of archaeology may be more talk than action and these results would support that hypothesis. However, the impact COVID-19 has had on habits is unknown and so until a survey is conducted under ‘normal’ circumstances there should be a degree of healthy scepticism of the results.
Note: currently, the health advice is to not drink more than 14 units of alcohol in a week and to spread out such drinking out over at least three days.
Table 2.13.1: Drinking habits for UK professional archaeologists and the habits for England – data from NHS England.
| Drinking Habits | Archaeologists Count | % of archaeologists | England % |
|---|---|---|---|
| Don’t drink | 153 | 15% | 20% |
| up to 14 units | 684 | 69% | 57% |
| 14-21 units | 98 | 10% | 8% |
| 21-35 | 36 | 4% | 8% |
| 35-50 | 11 | 1% | 3% |
| more than 50 units | 7 | 1% | 3% |
| Median number of Units | 4.5 | 6.0 | |
| Average number of Units | 7.5 | 12.2 |
Download this table:
Correlations
Warning: As discussed in the methods, ‘statistically significant results’ means nothing more than these results are worthy of further investigation. The low r-values are not ‘proof’.
The analysis of the survey variables (see methods section) highlighted several correlations between drinking and other variables. One was that women archaeologists less likely to drink and to drink less when they do, a pattern observed in the general population (Table 2.13.2). Not enough other genders were sampled to provided any insights into them.
Table 2.13.2: Drinking habits for UK professional archaeologists and the habits for England by gender.
| Drinking habits | Women Archaeologists | England Women | Men Archaeologists | England Men | ||
|---|---|---|---|---|---|---|
| Count | % | % | Count | % | % | |
| Don’t drink | 91 | 19% | 23% | 59 | 12% | 17% |
| up to 14 units | 335 | 71% | 62% | 321 | 67% | 53% |
| 14-21 units | 34 | 7% | 7% | 59 | 12% | 10% |
| 21-35 | 5 | 1% | 5% | 30 | 6% | 10% |
| 35-50 | 4 | 1% | 2% | 7 | 1% | 5% |
| more than 50 units | 1 | 0% | 1% | 6 | 1% | 5% |
Download this table:
Disabled archaeologists were less likely to drink, especially those with physical disabilities. However, those with emotional disabilities (including, but not limited to: anxiety, schizophrenia, bipolar, obsessive compulsive, depression, etc.) are significantly more likely to drink. Drinking is linked to these disabilities so it could be that the archaeologists drinking is causing or exacerbating these disabilities, but making such a determination is not possible with these data and this is only a speculation. Those who found that working in archaeology causes or makes their disabling conditions worse were also less likely to drink.
Table 2.13.3: Drinking habits for UK professional archaeologists by disability status and selected disabilities, 2019-20.
| Drink | Don’t Drink | |||
|---|---|---|---|---|
| Count | % | Count | % | |
| Disabled – No | 760 | 87% | 115 | 13% |
| Disabled – Yes | 66 | 64% | 37 | 36% |
| Physical Disability | 43 | 68% | 20 | 32% |
| Emotional Disability | 29 | 94% | 2 | 6% |
| Condition(s) caused by or exacerbated by work – yes | 34 | 69% | 15 | 31% |
Download this table:
Additional Correlations
Our analysis flagged up an additional correlation, but, as discussion in the methods section, R numbers are only used as a guide to alert us to areas that might need further investigation. Areas that were investigated but not found to be insightful were relationships between drinking more if one’s parent / guardian had a job in the lower managerial and professional occupations. Due to the nature of how Chi Squares work, slight variations in large samples can be flagged up. In this case, the parent’s occupation, lower managerial and professional occupations, made up a third of responses so that the 89% of archaeologists drinking with this background was flagged up even though it is only 4% higher than the average for the profession. This is not an insightful find but a drawback of R numbers.
Image Credit
Treatise on the Vices – ‘Cellarer and barrels’. From British Library via Flickr. ID: 020586.
Version control and change log
As a digital document we may update parts of this page in the future to account for corrections or the need for clarification. Please use the version when citing:
Version: 1.0
Change log: no changes
CREDITS
Title: Profiling the Profession
2020 Authors: Kenneth Aitchison, Poppy German and Doug Rocks-Macqueen
Published by: Landward Research Ltd
Version Date: 2021
ISBN: 978-0-9572452-8-0
DOI: https://doi.org/10.6084/m9.figshare.14333387
License: CC BY SA 4.0 for all text and figures. Header images are from different sources check image credits for their specific licensing.
2020 funders: Historic England, with support from Historic Environment Scotland, CIfA and FAME.
Questions about Profiling the Profession: enquiries@landward.eu